

Starting small taught me big lessons
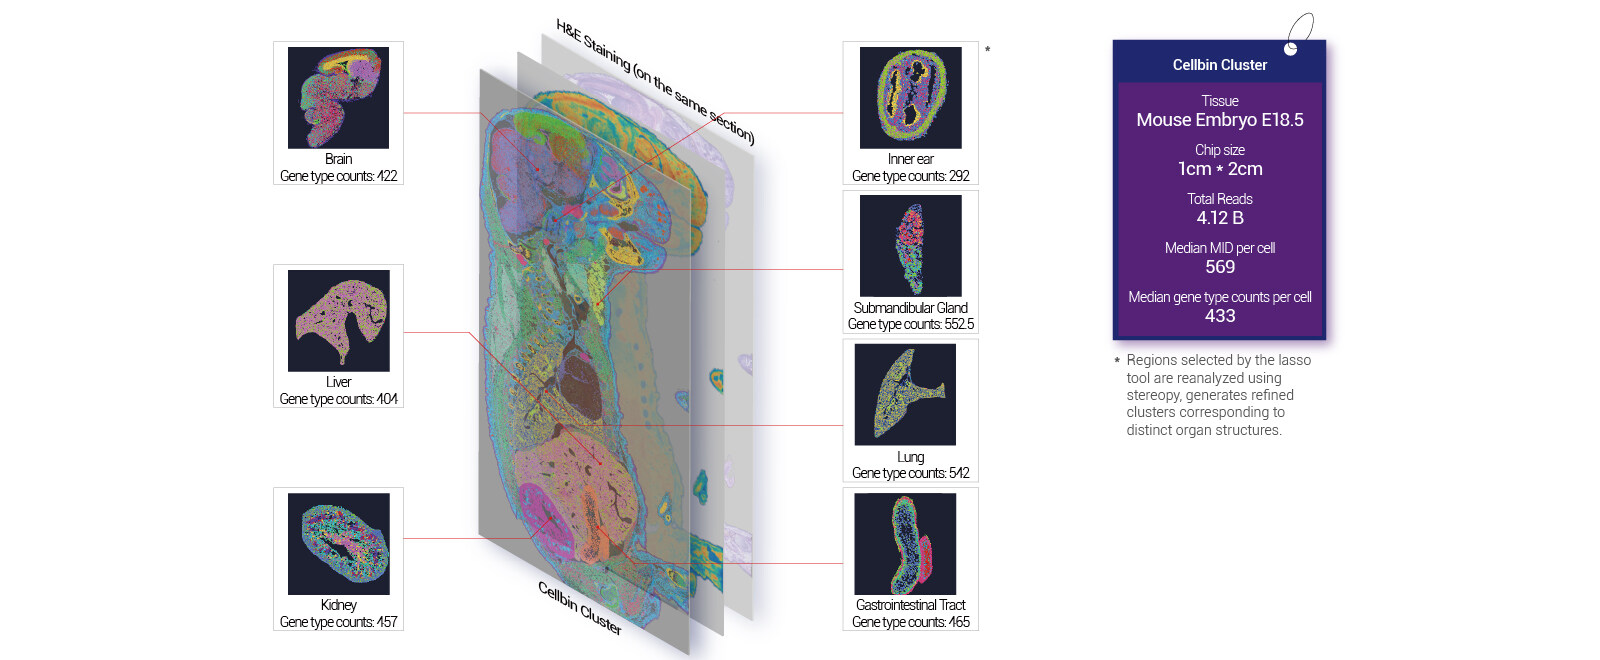
I remember loading a 10 mm liver section on a large-chip run last spring and feeling sure we’d nailed scale—then the mapping told a different story. I ran that pilot because I wanted to test high-resolution large-field spatial transcriptomics on true clinical-sized tissue; the run returned 1.9 million uniquely mapped UMIs from the margin—so what’s the reliable path from an impressive dataset to routine, reproducible results? In my experience with large stereo seq transcriptomics the gap is rarely the sequencer—it’s the capture workflow, spatial barcoding layout, and how you manage read depth across uneven tissue morphology. I felt that hit in my hands (and in the QC report) — and it forced a shift in how I coach teams toward consistent outputs.
Where traditional solutions trip up
I’ve run more than 200 spatial runs over the last 15 years, and patterns repeat. First, people assume linear scaling: bigger chip = same capture efficiency. Not true. Barcode collision and spot-size mismatches spike when you scale without rethinking tissue prep. Second, uneven read depth kills comparisons across regions; you get artifacts that masquerade as biology. Third, the standard pipelines often ignore tissue-specific RNA degradation—so transcripts look sparse. I saw that in March 2023 at our Boston core: a colorectal specimen lost 32% of expected mitochondrial reads after a routine fixation tweak, and downstream cell-type calls changed. That single detail saved me from a bad biological claim. I’m direct about this because aiming higher means fixing these engineering and wet-lab flaws first.
Comparing the paths: resolution versus coverage
Now I compare options like a coach sizing a training plan: do you prioritize per-spot sensitivity (resolution) or whole-tissue coverage (field)? High-resolution grids minimize cell mixing but demand deeper read depth and careful spatial barcoding; wide-field chips lower per-spot depth but capture larger context. When I benchmark platforms I look at three things: mapped UMIs per mm², barcode collision rate, and the effective spot size vs. cell diameter. (Yes — you must measure cell diameter in your tissue type.) Using high-resolution large-field spatial transcriptomics changed one of my lab’s decisions: we moved from tiled small chips to a single large-chip run because the network cost and handling time fell by 40%, while spatial continuity improved. The choice wasn’t obvious at first, but the comparative data made it clear.
What’s Next?
How I evaluate platforms — three concrete metrics
I use three hard metrics before I recommend a platform to a core facility manager or PI. 1) Effective mapped transcripts per mm² (this tells you raw signal). 2) True barcode collision rate after demultiplexing (this tells you noise). 3) Operational throughput — minutes per slide from thaw to library (this tells you cost and scheduling). I scored options in January 2024 across those metrics and dropped one vendor who failed on collision control. Short aside — testing is brutal. It costs time, money, and patience — but it prevents bad conclusions. Finally, choose systems that give you clear control points: tissue fixation, spatial barcoding parameters, and flexible read depth. I’ve learned to prioritize reproducible pipelines over flashy demos. If you want a partner that balances scale and resolution, check the practical resources from stomics.